
Bulk postal-code import
Paste a list or scan a spreadsheet for Canadian postal codes. The workflow identifies valid entries, unique FSA regions, and unrecognized values.
Postal code customer mapping
Import Canadian postal codes in bulk to see where customers are concentrated and connect those locations with the audience and market context around them.
Turn postal codes into a customer map
AudienceScout customer mapping software turns a pasted list or spreadsheet of Canadian postal codes into a regional frequency map. Full customer names, email addresses, order details, and street addresses are unnecessary for the mapping workflow; a postal-code column is enough to begin.
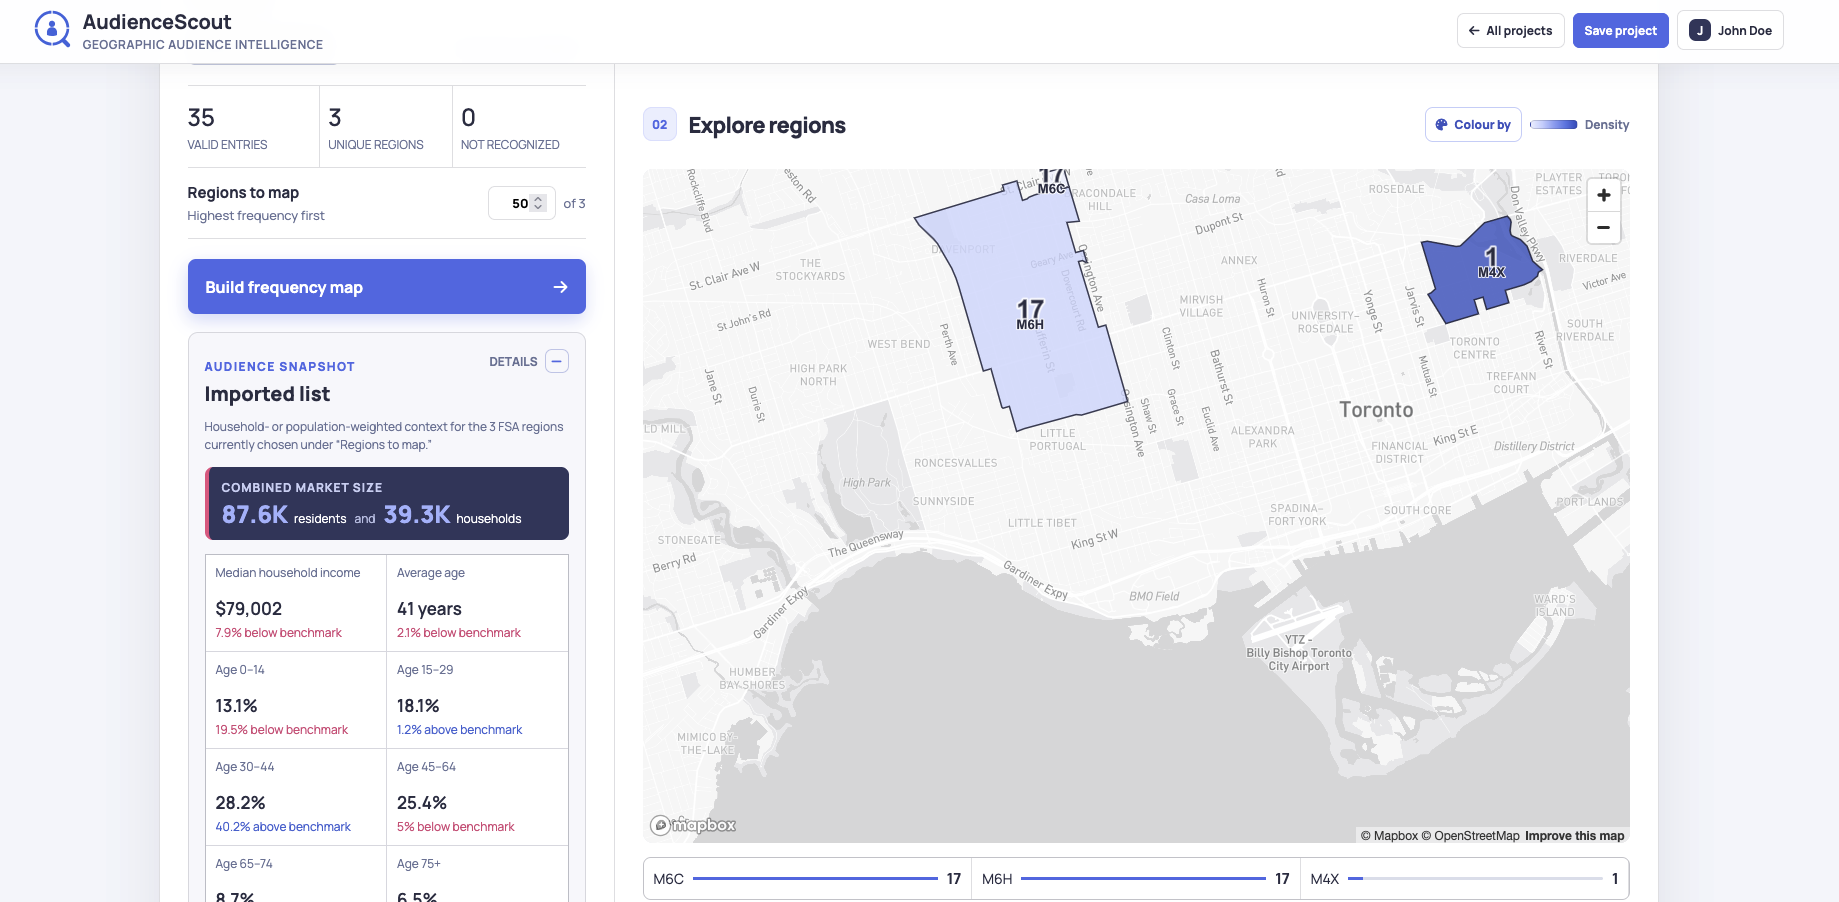
Postal codes are grouped into three-character FSA regions and repeated occurrences are preserved. The resulting map shows where the list is concentrated, while the ranked regional summary makes it easy to identify the strongest customer clusters.
Frequency becomes more useful when it is compared with local market size. AudienceScout calculates entries per 1,000 residents and per 1,000 households for mapped regions, helping reveal areas with strong customer penetration as well as large markets with room for further development.
Customer Mapping Software features
Build a practical market view from the postal regions, measures, and campaign signals that support the decision.
Paste a list or scan a spreadsheet for Canadian postal codes. The workflow identifies valid entries, unique FSA regions, and unrecognized values.
Visualize the postal regions in the list and colour each region by frequency to quickly find the largest geographic concentrations.
Compare list entries per 1,000 residents and per 1,000 households to understand customer strength relative to the size of each local market.
Combine mapped regions into an audience snapshot and explore the demographic, business, facility, and platform context connected to those locations.
How it works
Move from Canadian postal geography to an audience and campaign plan your team can review and use.
Copy a column of Canadian postal codes from your sales, CRM, lead, donation, membership, or response data. A simple list is enough for the quick mapping workflow.
Add the codes directly or choose a spreadsheet. AudienceScout scans the list, groups recognized codes by FSA, and summarizes entry frequency.
Display the represented regions on the map, compare their counts, and inspect penetration relative to local population and households.
Review the combined audience profile, compare customer regions, choose markets for the next campaign, and copy the FSA targeting list.
From customer map to growth plan
A customer map establishes where the current base is strongest. AudienceScout adds the measures needed to interpret that pattern: population, household scale, demographic composition, local business activity, facilities, and channel-planning estimates.
Use audience thresholds to identify more regions that fit the characteristics of a campaign, or compare loaded markets with a selected group of proven customer regions. The final selection can include established strongholds, nearby growth areas, or a balanced mix designed for a measurable regional test.
Ways to use it
Map customer postal codes to find core markets, compare customer penetration, and identify regions for acquisition or retention campaigns.
Visualize member, donor, or supporter locations and use local audience context to plan regional awareness and outreach.
Compare customer geography around locations, assess regional market size, and explore areas that resemble established trade areas.
Customer Mapping Software questions
You need a list of Canadian postal codes. They can come from sales, customer, lead, donor, member, response, or location data. The quick mapping workflow does not require names, emails, or full street addresses.
Yes. Import an Excel workbook and AudienceScout scans its worksheets for Canadian postal codes. You can also paste postal codes directly into the list builder.
Postal codes are grouped into Canadian FSA regions using their first three characters. The frequency map colours those regions based on the number of list entries and provides a ranked count for each area.
Repeated occurrences are preserved in the regional frequency count. This allows the map to show where more customer, response, or transaction rows are concentrated.
For regions with bundled audience profiles, AudienceScout calculates entries per 1,000 residents and per 1,000 households. These normalized measures help compare regions with different market sizes.
Yes. Review the audience characteristics of strong customer regions, use demographic threshold matching, and compare look-alike scores across other postal regions loaded for a city.
Postal-code rows are processed in the browser. Saved projects retain aggregate FSA identifiers and counts used by the project, allowing the customer map and audience analysis to be restored without saving the original rows.
Related AudienceScout guides