
Regional market maps
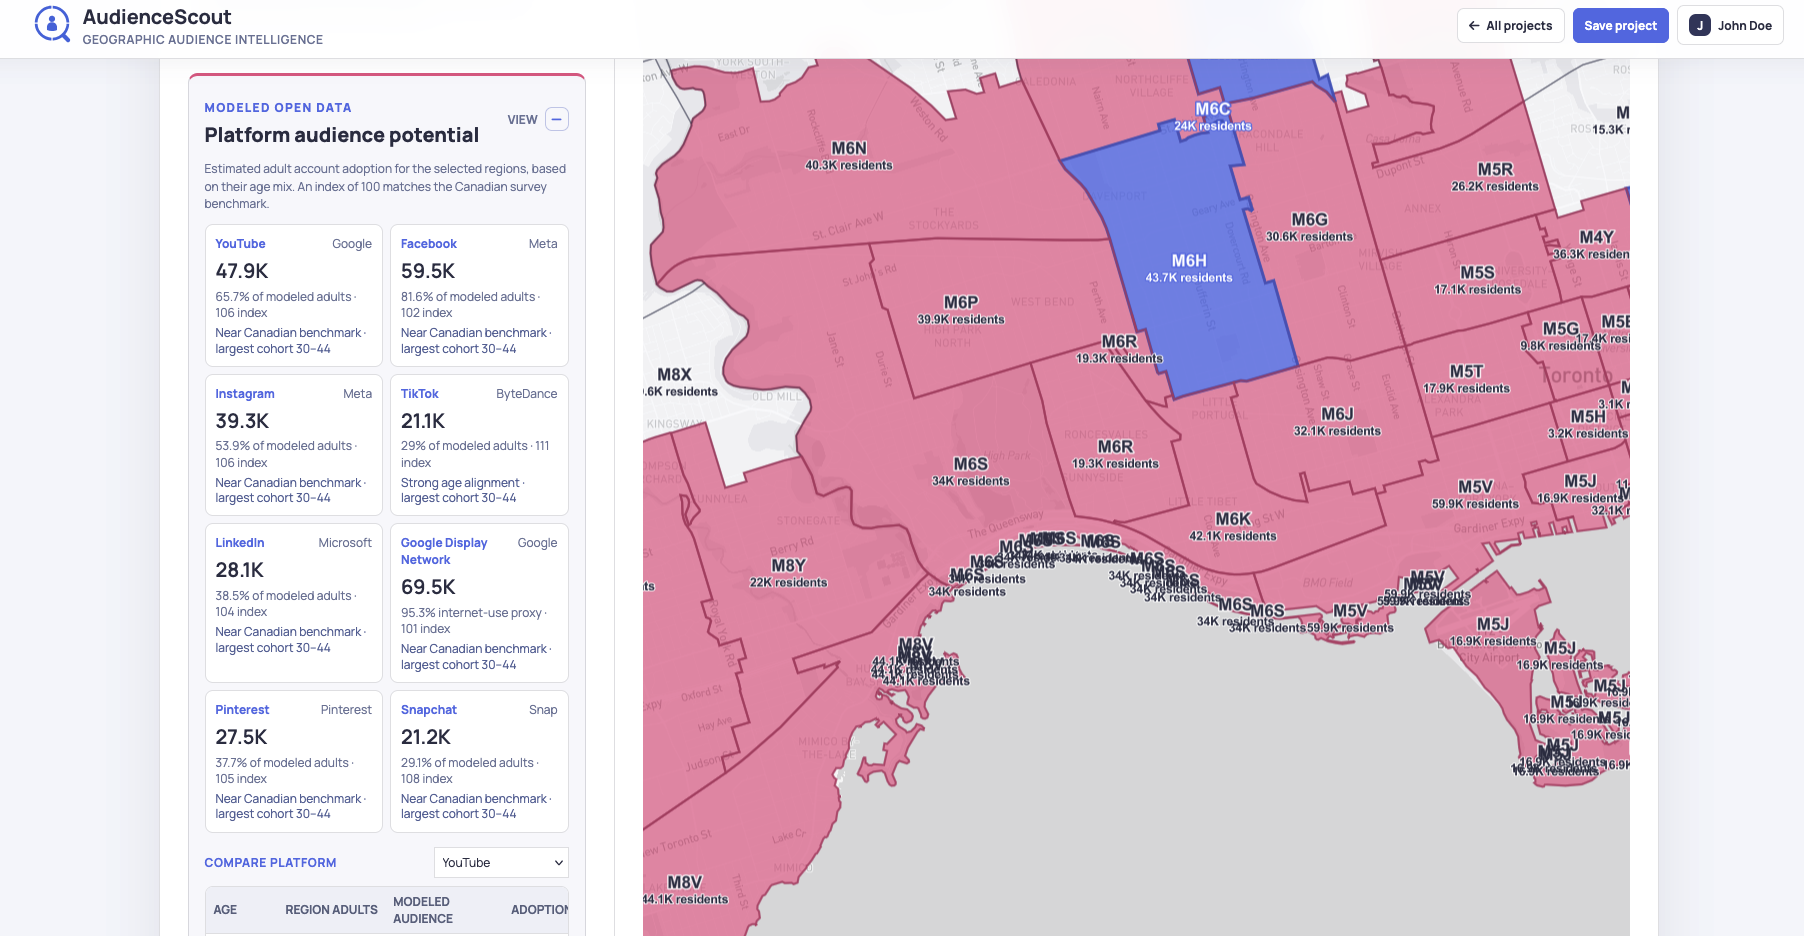
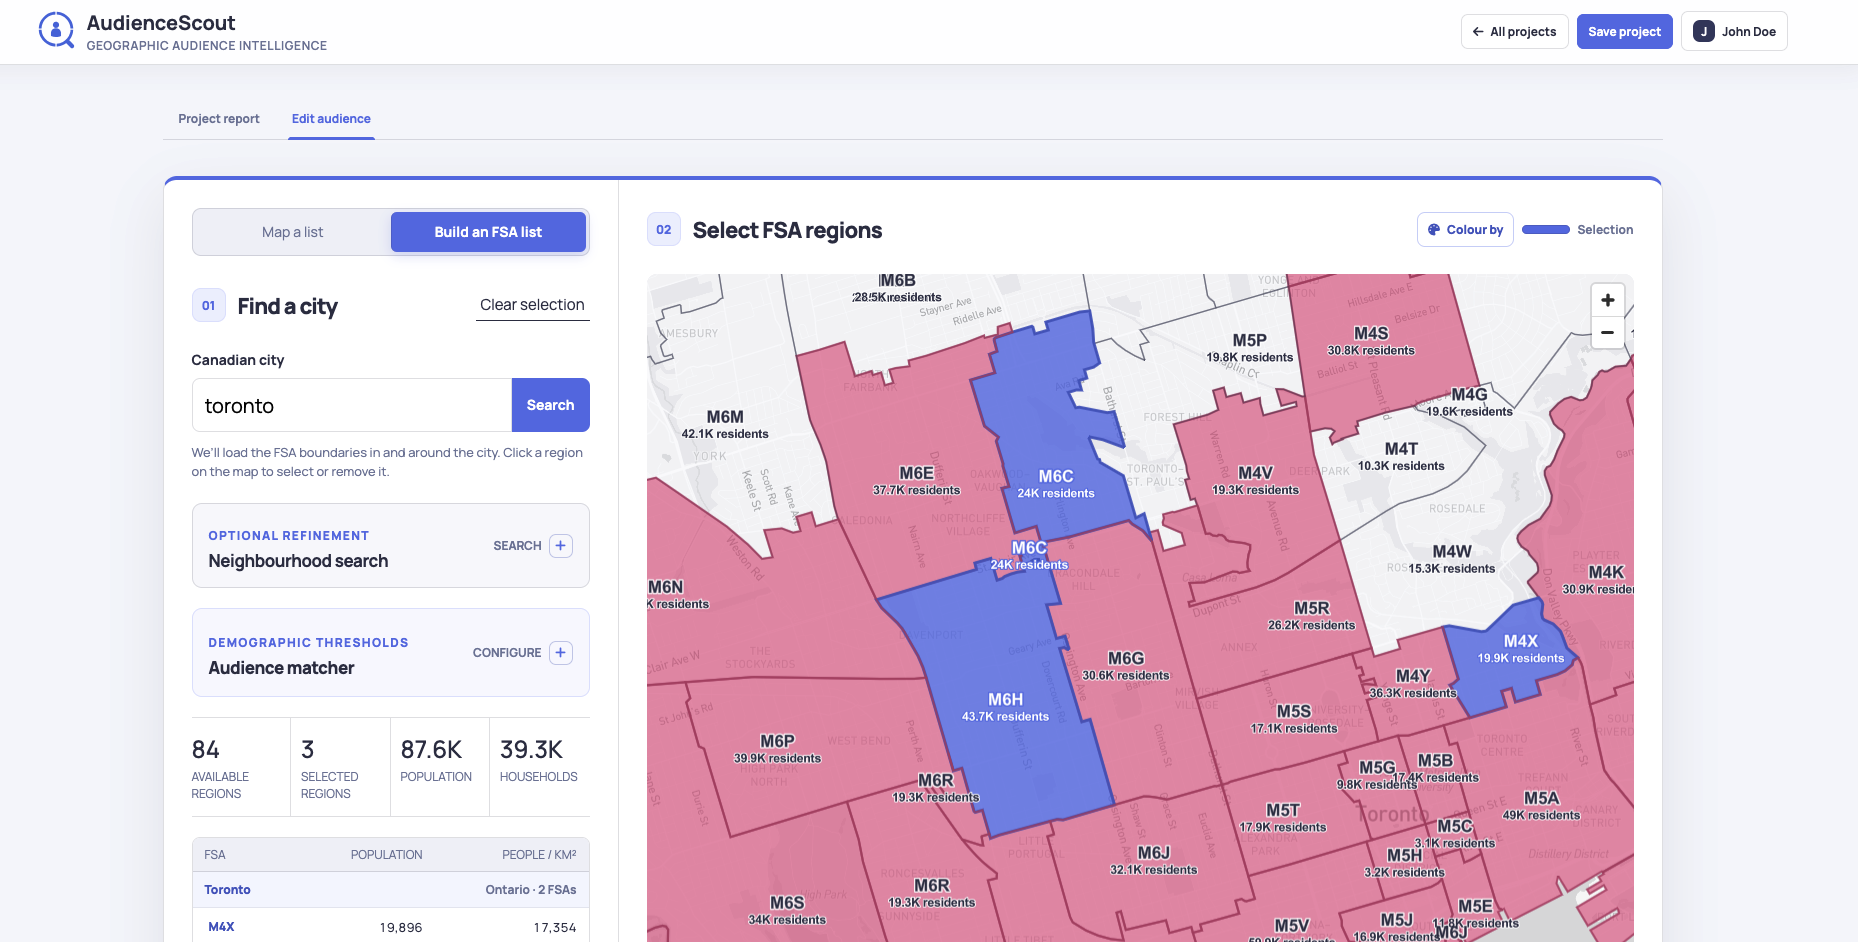
Explore Canadian FSA boundaries on an interactive map and colour regions by customer frequency, demographics, context measures, or platform potential.
Canadian market intelligence
Compare Canadian postal regions using customer concentration, demographics, business activity, local facilities, and campaign-ready audience measures.
Understand why markets perform differently
Geographic market analysis helps explain where customers are concentrated, how local audiences differ, and which regions offer a strong fit for the next campaign. AudienceScout organizes the analysis around Canadian FSA postal regions so insights can move directly into geographic media and outreach plans.
Start by importing postal codes from customers, leads, responses, or other location-based activity. The frequency map reveals the regions with the most entries, while normalized penetration compares that activity with local population and households. This helps distinguish large markets from areas where the customer base has developed unusual strength.
Explore each region with consistent measures for population, income, age, households, families, housing, education, immigration, and work patterns. Business categories, education and health facilities, culture and recreation locations, and modeled platform audiences add context for campaign and market decisions.
Geographic Market Analysis features
Build a practical market view from the postal regions, measures, and campaign signals that support the decision.
Explore Canadian FSA boundaries on an interactive map and colour regions by customer frequency, demographics, context measures, or platform potential.
Review every loaded region with the same population, household, income, age, housing, education, and penetration measures.
Compare the number of businesses in selected NAICS categories and review nearby education, health, culture, recreation, and sport facilities.
Use threshold matching and look-alike scores to find regions that share the audience characteristics connected to strong markets.
How it works
Move from Canadian postal geography to an audience and campaign plan your team can review and use.
Choose the outcome the analysis should support, such as improving campaign coverage, finding expansion markets, reviewing a service area, or understanding the current customer base.
Import a postal-code list or search a Canadian city. AudienceScout groups the activity into FSA postal regions and loads the local market profiles.
Review customer penetration, demographics, household measures, local business categories, facilities, and platform potential to identify meaningful regional patterns.
Select the regions supported by the analysis, export their FSA codes, and document the rationale in a campaign planning report.
Practical market decisions
The strongest geographic analysis connects several signals to a specific decision. A high-volume region may deserve continued investment, while an area with similar audience characteristics and lower customer penetration may offer an expansion opportunity. AudienceScout keeps both measures visible so teams can discuss reach, fit, and current performance together.
Audience matching thresholds provide a consistent way to narrow large markets. Look-alike analysis can then compare loaded regions with the combined profile of selected seed areas, helping identify nearby markets whose strongest demographic dimensions resemble proven customer regions.
Ways to use it
Discover where customers are concentrated and which demographic or market characteristics stand out across the strongest postal regions.
Compare current high-performing regions with surrounding markets and build a focused test plan for areas with similar audience characteristics.
Review household scale, audience fit, and local market context before defining sales territories, service zones, or regional campaign coverage.
Geographic Market Analysis questions
Geographic market analysis compares customer activity, audience characteristics, and local market signals across defined areas. AudienceScout uses Canadian FSA postal regions so the analysis can support practical campaign targeting and regional planning.
AudienceScout includes population, households, income, age, families, housing, education, immigration, work mode, business categories, local facilities, customer penetration, and modeled platform audience potential.
Import a spreadsheet or paste postal codes in bulk. AudienceScout creates a frequency map, preserves repeated entries for concentration analysis, and calculates normalized entries per 1,000 residents and households where profile coverage is available.
Yes. Compare strong customer regions with other loaded-city FSAs, use audience matching thresholds to find qualifying areas, and apply look-alike scores to identify regions with similar demographic profiles.
Yes. Search the bundled NAICS catalogue or select a broad business category to compare the number of matching business records within the selected postal regions.
Select the regions supported by the analysis and copy or download their FSA codes. You can also save the market as a project and create a report containing the map, market size, audience profile, platform potential, and regional rationale.
Related AudienceScout guides